-
Home
-
Publications and submissions
-
Reports
-
EWON Insights
-
EWON Insights Jul-Sep 2020
- Complaint activity
Complaint activity
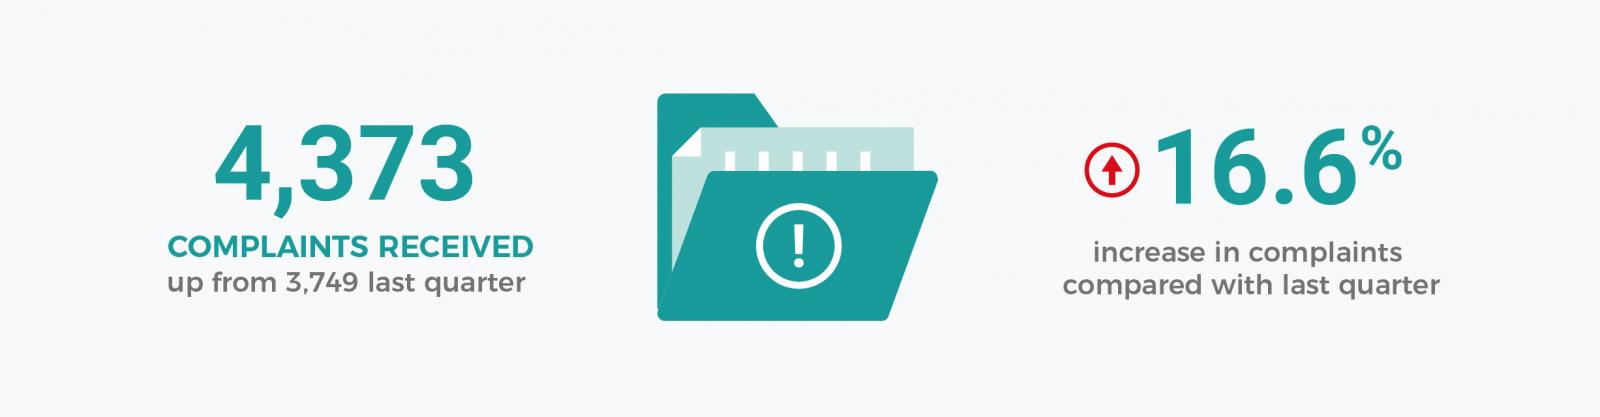
Complaints to EWON increased this quarter by 16.6% to 4,373 (up from 3,749 last quarter), due to an increase in complaints from electricity and gas customers. This increase may be due to the easing of COVID-19 government stimulus and subsequent financial pressures on consumers. The continued restrictions on various credit activities by the Australian Energy Regulator (AER) in its Statement of Expectations, together with government stimulus support, are likely contributing factors for the decline in complaints this quarter compared to the same quarter last year.
.jpg)
Electricity: The 3,149 electricity retail complaints we received during the period represent an 18.5% increase on last quarter’s 2,658 complaints. Network complaints decreased by 3.1%; 251 complaints compared to 259 in the previous quarter. Total electricity complaints rose by 15.4% to 3,454 compared to the previous quarter.
Gas: The number of gas retail complaints received during the quarter (673) increased by 29.4% compared with the previous quarter (520). The number of gas network complaints (50) increased by 29 from the previous quarter. At 739, overall gas complaints were 34.1% higher compared to the 551 complaints received last quarter.
Water: The number of water complaints received this quarter (156) decreased by 18.3% compared to last quarter (191).
Exempt entities: We received 111 complaints from embedded network customers this quarter. Of these, 81 were about authorised electricity retailers and 21 about exempt retailers.
The graph below shows an overview of complaint activity from July to September 2020.
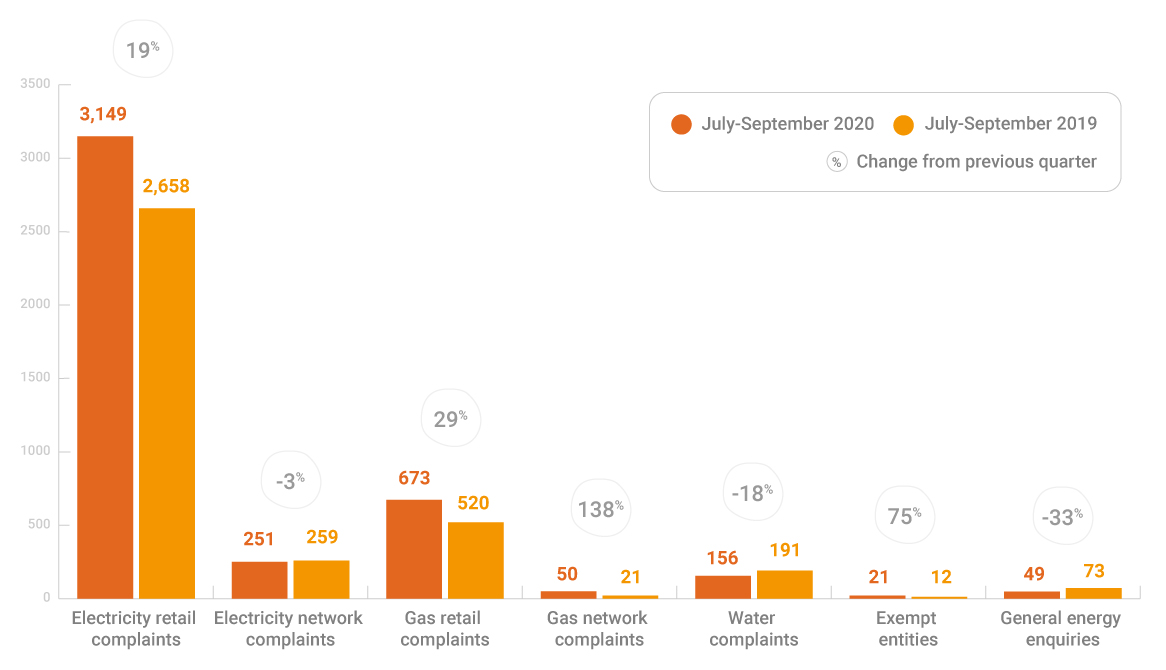
Table 1 provides detailed information about the number of complaints received from July to September 2020 compared to the previous four quarters.
| Case subject | Provider type | Jul 20 – Sep 20 | Apr 20 – Jun 20 | Jan 20 – Mar 20 | Oct 19 – Dec 19 | Jul 19 - Sep 19 |
|---|---|---|---|---|---|---|
| Electricity | Exempt retailer | 21 | 12 | 14 | 8 | 9 |
| Electricity | Network | 251 | 259 | 368 | 235 | 202 |
| Electricity | Retailer | 3,149 | 2,658 | 3,457 | 3,764 | 4,105 |
| Electricity | Not allocated | 33 | 63 | 101 | 80 | 100 |
| Electricity | Total | 3,454 | 2,992 | 3,940 | 4,097 | 4,416 |
| Case subject | Provider type | Jul 20 – Sep 20 | Apr 20 – Jun 20 | Jan 20 – Mar 20 | Oct 19 – Dec 19 | Jul 19 -Sep 19 |
|---|---|---|---|---|---|---|
| Gas | Exempt retailer | 0 | 0 | 0 | 1 | 0 |
| Gas | Network | 50 | 21 | 31 | 42 | 40 |
| Gas | Retailer | 673 | 520 | 658 | 755 | 898 |
| Gas | Not allocated | 16 | 10 | 8 | 12 | 11 |
| Gas | Total | 739 | 551 | 697 | 810 | 949 |
| Case subject | Provider type | Jul 20 – Sep 20 | Apr 20 – Jun 20 | Jan 20 – Mar 20 | Oct 19 – Dec 19 | Jul 19 -Sep 19 |
|---|---|---|---|---|---|---|
| Non-energy/non-water | Not allocated | 24 | 15 | 22 | 20 | 9 |
| Non-energy/non-water | Total | 24 | 15 | 22 | 20 | 9 |
| Case subject | Provider type | Jul 20 – Sep 20 | Apr 20 – Jun 20 | Jan 20 – Mar 20 | Oct 19 – Dec 19 | Jul 19 -Sep 19 |
|---|---|---|---|---|---|---|
| Water | Network | 44 | 74 | 85 | 65 | 65 |
| Water | Retailer | 92 | 99 | 129 | 118 | 142 |
| Water | Not Allocated | 20 | 18 | 24 | 17 | 25 |
| Water | Total | 156 | 191 | 238 | 200 | 232 |