-
Home
-
Publications and submissions
-
Reports
-
EWON Insights
-
EWON Insights Oct-Dec 2020
- Energy complaints
Energy complaints
The graph below shows the breakdown of electricity and gas complaints by category, received in Oct-Dec 2020. An accessible version of this information is included in the table below.
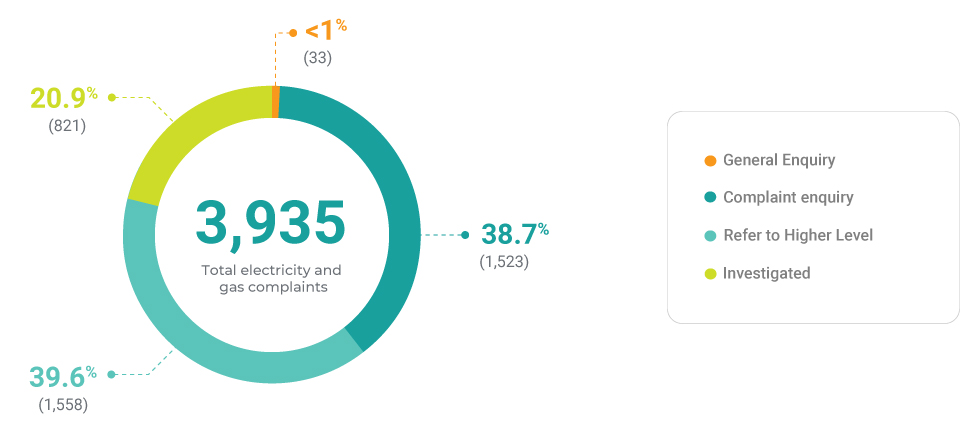
Table 5 – Complaint breakdown – Energy
| Complaint type | Number of complaints | % Total energy complaints |
|---|---|---|
| General enquiry | 33 | 0.8% |
| Complaint enquiry | 1,523 | 38.7% |
| Refer to Higher Level | 1,558 | 39.6% |
| Investigated | 821 | 20.9% |
| Total | 3,935 | 100% |